Skip to content

Pinpoint emerging trends with our data visualization solutions

We'll build visualization tools to provide answers to complex dataset questions you need to answer

Frame 85

Data Visualization

Data visualization (dataviz) is the graphical representation of information and data. By using charts, plots, graphs, and infographics - data visualization provides a visual way to understand trends, and patterns in data - especially for large data sets and non-technical audiences.

Consider the following statistics from the University of Minnesota:

  • 50% of the human brain is used to process visual information
  • people can retain 65% of the information three days after looking at an image with data compared to 10% of the information they hear
  • 65% of the human population are visual learners, indicating that most of us need to see information to retain it

Make informed data visualization driven decisions to drive commercial growth, improve customer experience and a healthier bottom line

What kinds of Data visualization needs do you have? Harvard Business Review defines 4 types of data visualization:

  • Idea illustration
    • Info type: Process, framework
    • Typical setting: presentations, teaching
    • Primary skills: Design, editing and
    • Goals: Learning, simplifying, explaining
  • Idea generation
    • Info type: complex, undefined
    • Typical setting: working session, brainstorming
    • Primary skills: team-building, facilitation
    • Goals: Problem solving, discovery, innovation
  • Visual discovery
    • Info type: Big data, complex, dynamic
    • Typical setting: Working sessions, testing, analysis
    • Primary skills: Business intelligence, programming, paired analysis
    • Goals: Trend spotting, sense making, deep analysis
  • Everyday Dataviz
    • Info type: simple, low volume
    • Typical setting: formal, presentations
    • Primary skills: design, storytelling
    • Goals: affirming, setting context

While Excel and Google Sheets are still commonly used as data visualization tools, more intricate techniques can be used - including - infographics, bubble clouds, heat maps, time series, area and pyramid charts, scatter plots, etc

Key advantages of data visualization include:

  • Enables users to make better/quicker data driven business decisions 
  • Identifies correlations between operations and key drivers faster
  • Clarifies which factors influence customer behavior  
  • Unlocks hidden patterns, deeper trends and identifies areas that need immediate attention 
  • Enables audiences to absorb information quickly (visualize patterns & complex relationships)
  • Maintains an audience's interest with information they can understand
  • Easy to distribute, share insights and foster business users to interact with their data

How we can help

When your business accumulates vast amounts of data, it can be daunting to comb through it all to find patterns and trends. Data visualization provides easy-to-read, uniform, accessible ways to interpret and understand your data, allowing your business to make informed decisions.

There are numerous ways to display your data – from pictographs, to tables, to graphs or charts. Your business functionality and alignment will improve, as the ability to understand data will increase work efficiency, generate revenue, and identify opportunities. Data visualizations should be useful, visually appealing and never misleading.

We’ll customize and implement data visualization tools to let everyone in your organization see the info relevant to them, whether they need a high-level view or want to drill down to the finer details.

Frame 119 (3)

Customizable Tools

We'll implement software solutions that give everyone in the organization the information they need, with the ability to change the way you see and display it.


Frame 119 (4)

Data Aggregation & Warehousing

When your data is siloed in different locations and applications, it's almost impossible to get a full picture. We help you consolidate your data, allowing you to easily access and interpret it. 

Frame 119 (5)

Interpretation & Visualization

We will work with you to define key reporting metrics, develop efficient reporting formulas, and present your data in a way that lets you make data-driven decisions.

We've built numerous dashboards that drive better decision making

 
DATA VISIBILITY

Don't take our word for it

The Poeta team are wonderful to work with and they were able to deliver the solution quickly and effectively
Paul Crawford CEO, Northpoint

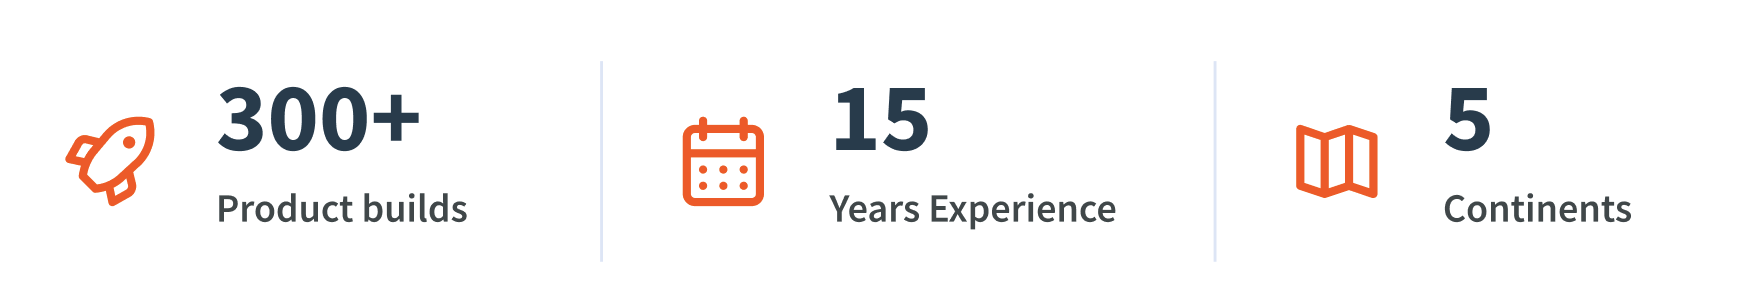
Poeta Digital is proud to support small, medium & multinational organizations in any industry

Screenshot 2022-11-04 at 1.33.59 PM

title photo (2)-1

Some of our clients

See how others have benefited

TEC
TEC CANADA

Realizing technology could increase the service and benefit TEC provided to its clients, together we designed and built an app that is a game-changer in their business.


RA-1
REAL AUTHENTICATION
Poeta Digital offered a dedicated team to Real Authentication to support their platform that leverages Artificial Intelligence and Machine Learning. The platform allows users to upload a photo of a luxury good and algorithms to identify counterfeit goods and forward seemingly authentic ones to an expert for verification.

Technologies supported

Check out some of our other industry leading services

Frame 85 (1)

App Development

We perform technology audits, identify, implement or build technology to transform your business and improve user experiences, adoption & engagement.

Frame 85 (2)

Staff Augmentation

We streamline workflows, integrate unconnected systems and utilize our Revenue Operations Systems to connect sales, marketing and operating services.

Frame 85

Full-Stack Development

Finding skilled full-stack developers in North America – let alone keeping them – is a true challenge. They simply do not exist in enough numbers to serve the market.